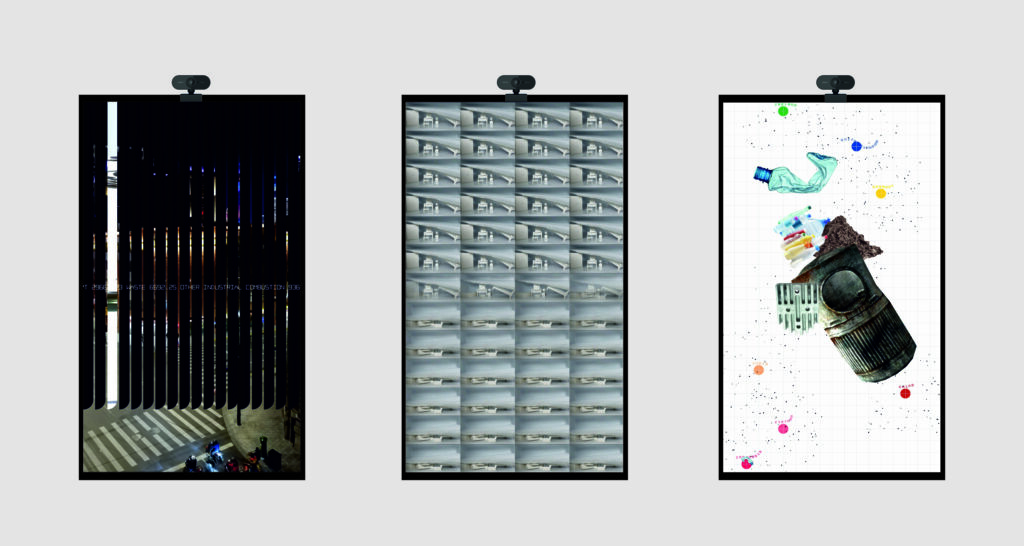
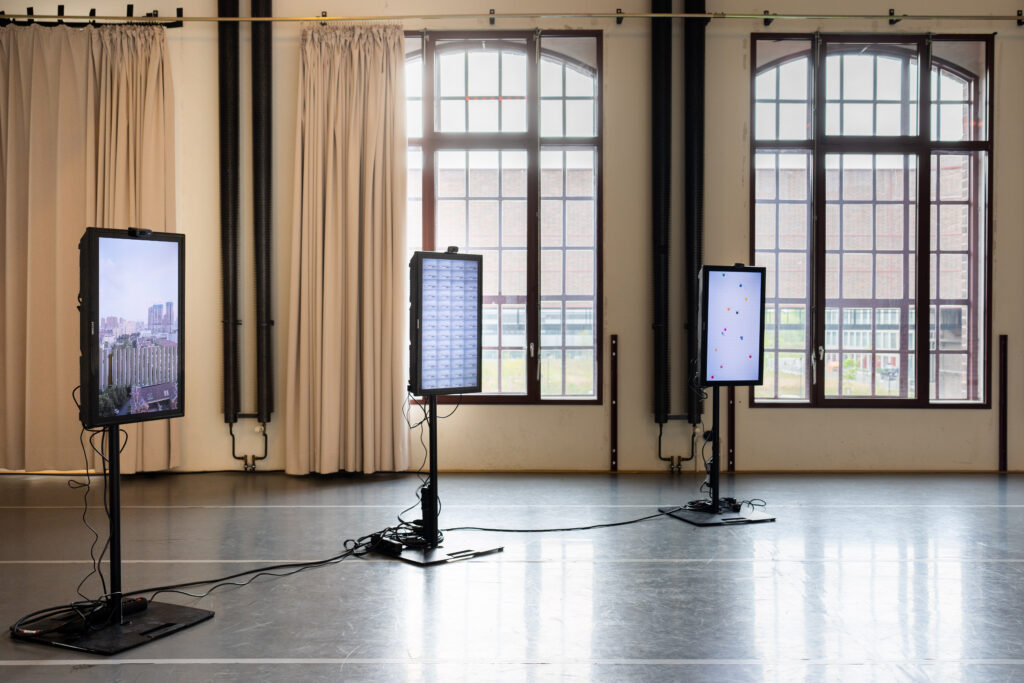
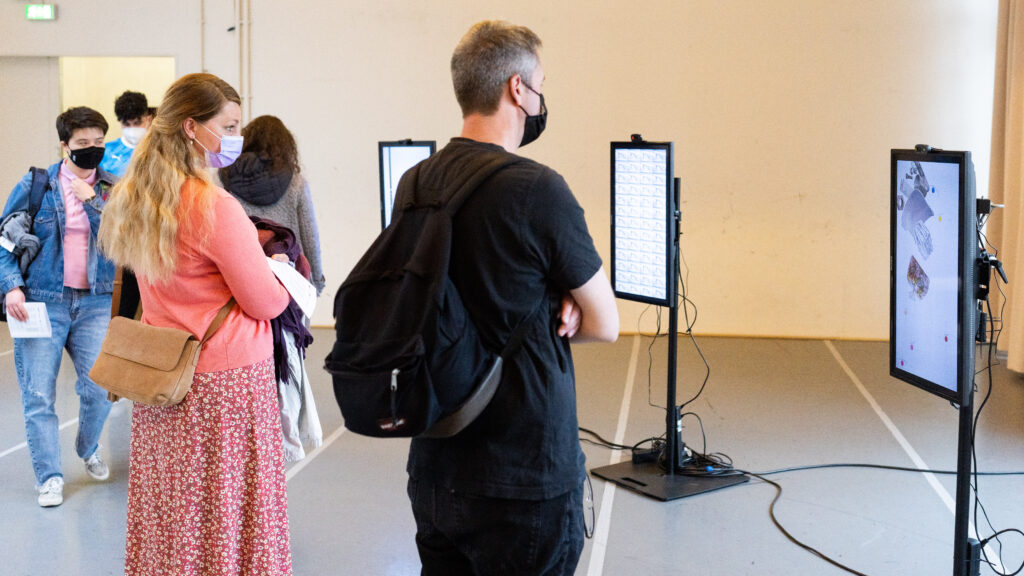
This project is the result of a two-week residency programme- 3rd Majhi International Art Residency (initiated and produced by the Durjoy Bangladesh Foundation (DBF)) from October 10, 2021, culminating in an exhibition launching on October 21, 2021. The project starts with three severe environmental issues – ocean suffocation, air pollution, and household waste, but those “global” issues are designed to manifest in place and culture-specific ways, facilitating moments of not only viewing the issues but also interacting with the content at the exhibition.
Screen 1
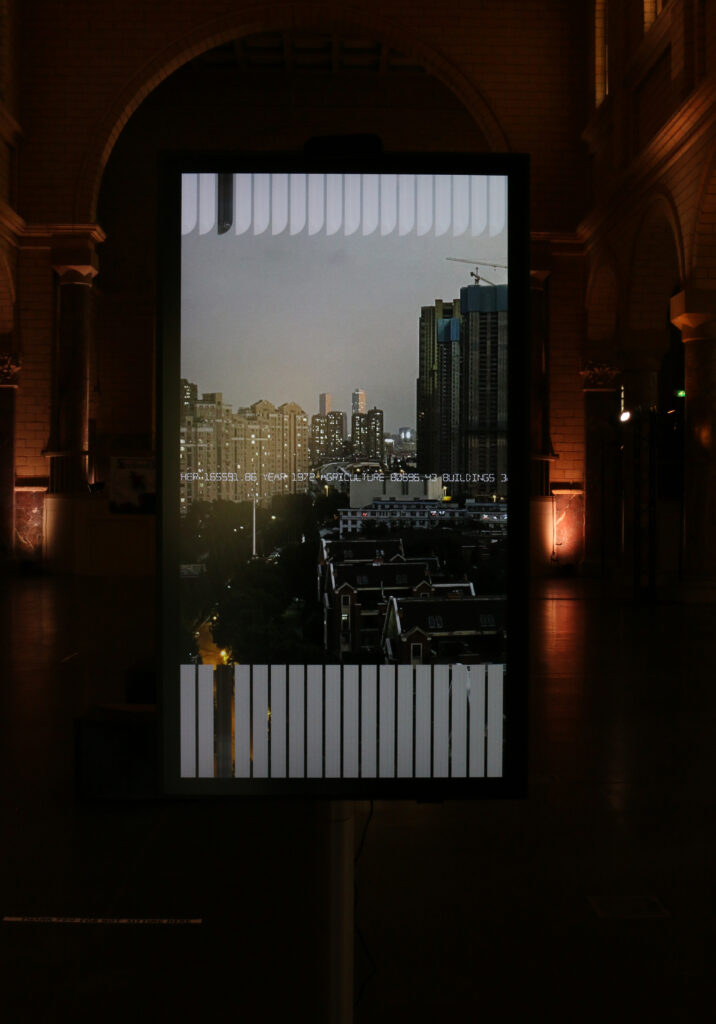
In the first screen, I use the annual average amount of Chinese PM2.5 emissions between 1970 and 2015 as data source, coming from the Emissions Database for Global Atmospheric Research. Among the different sectors, buildings directly generated almost half of the total amount of PM2.5 emissions every year for their heating and electricity demand in China.
What you see on the screen are time-lapse photos from three different Chinese cities: Wuxi, Beijing, and Shanghai, which were collected specifically for this installation. Pollution data is used in selecting the brush that paints over the city views. Their traces draw down and shape how cities look like. The design of the installation takes the presence of visitors in account and projects live images from visitors onto the brush, connecting the impact from a global crisis in general to individuals right here and now.
Screen 2
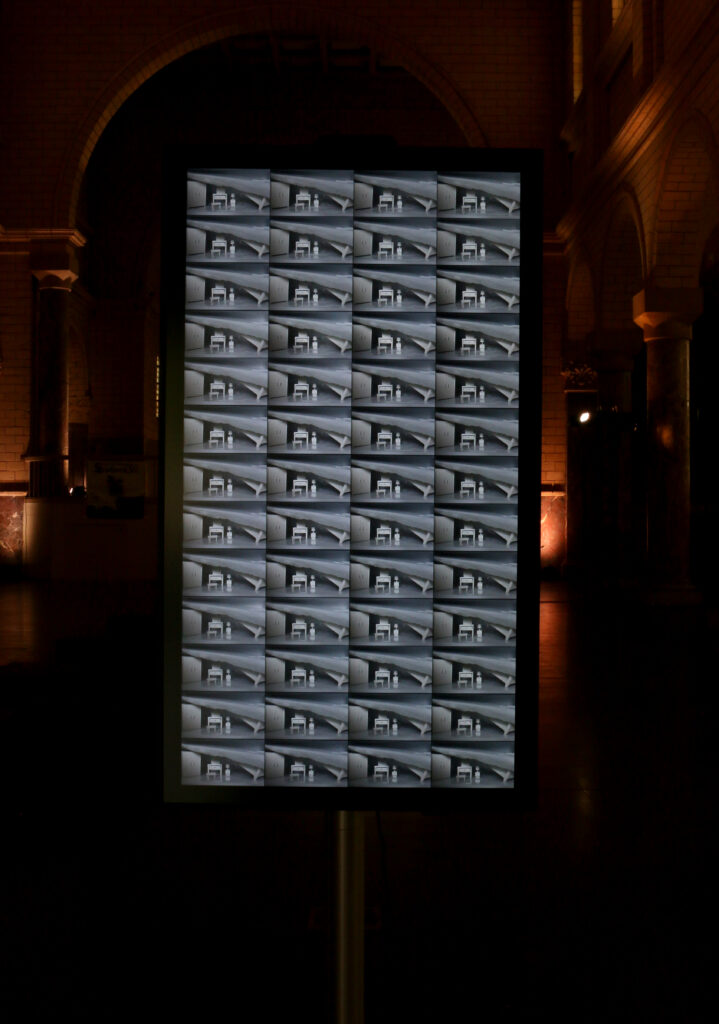
The second screen uses the heat content in the top 700 meters of the World’s Oceans between 1955 and 2020 as data source, coming from the National Oceanic and Atmospheric Administration. The data is quite simple and, unsurprisingly, ocean heat content has been climbing up year over year.
A small-scale bedroom is set up inside a freezer compartment of a very normal fridge. When the power is shut down, a 13-hour melting process is filmed and over 800 images are moving forward on the screen. This is metaphorically linked to visualize the difference in data between years of warming oceans. For the interaction, machine learning is used to detect visitors at the exhibition and connect with the density of content that visitors can see from the screen.
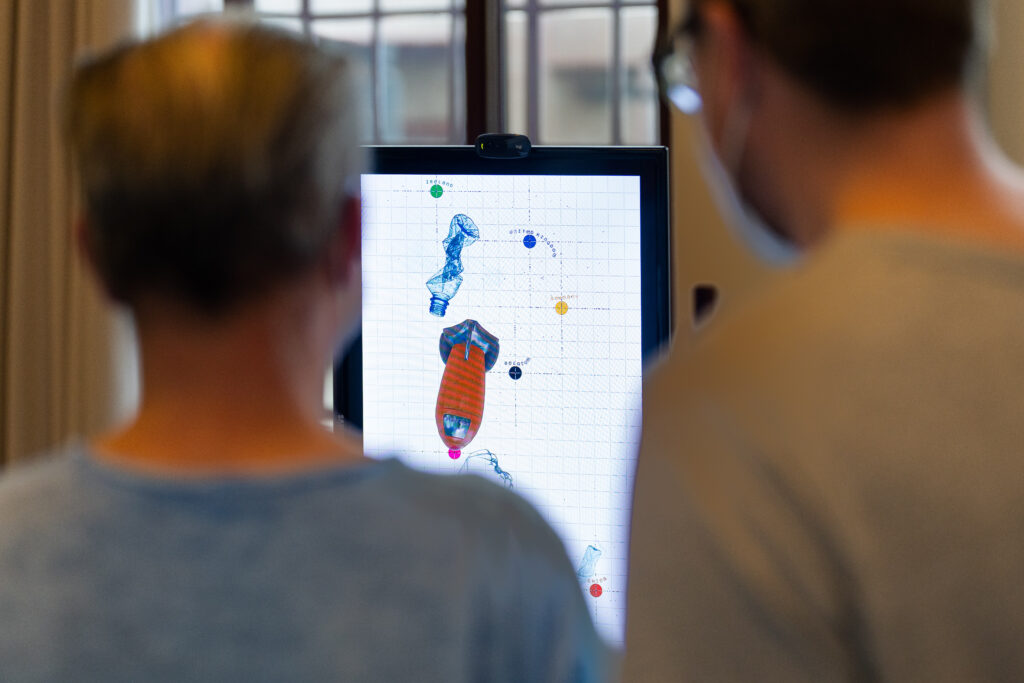
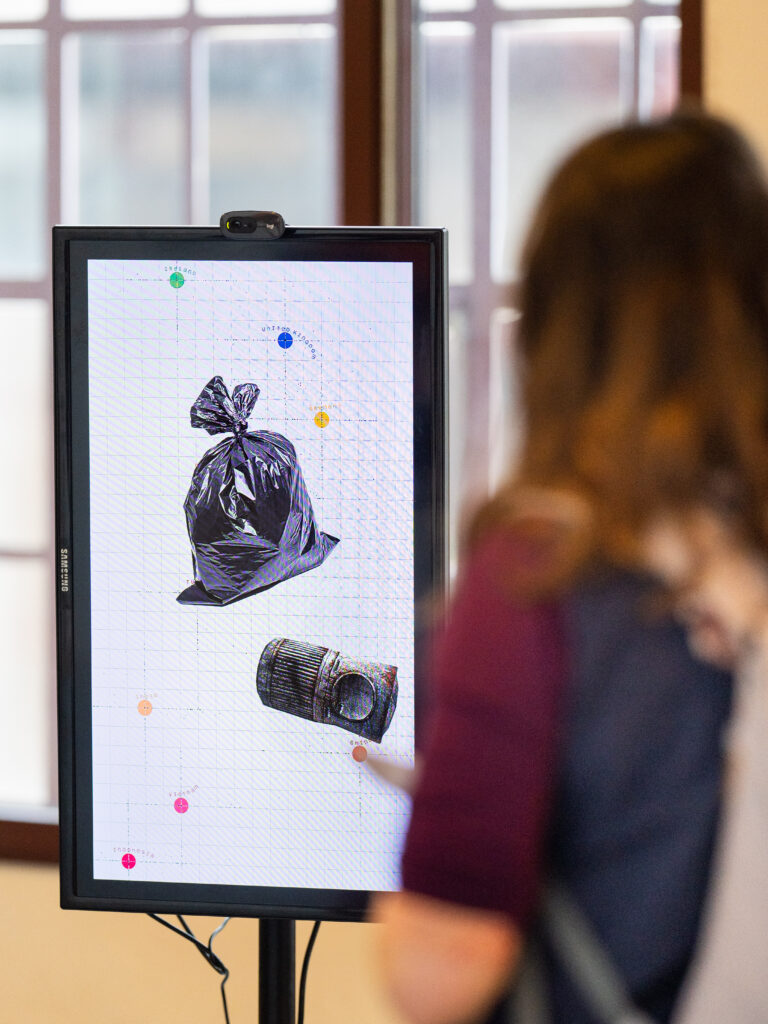
Screen 3
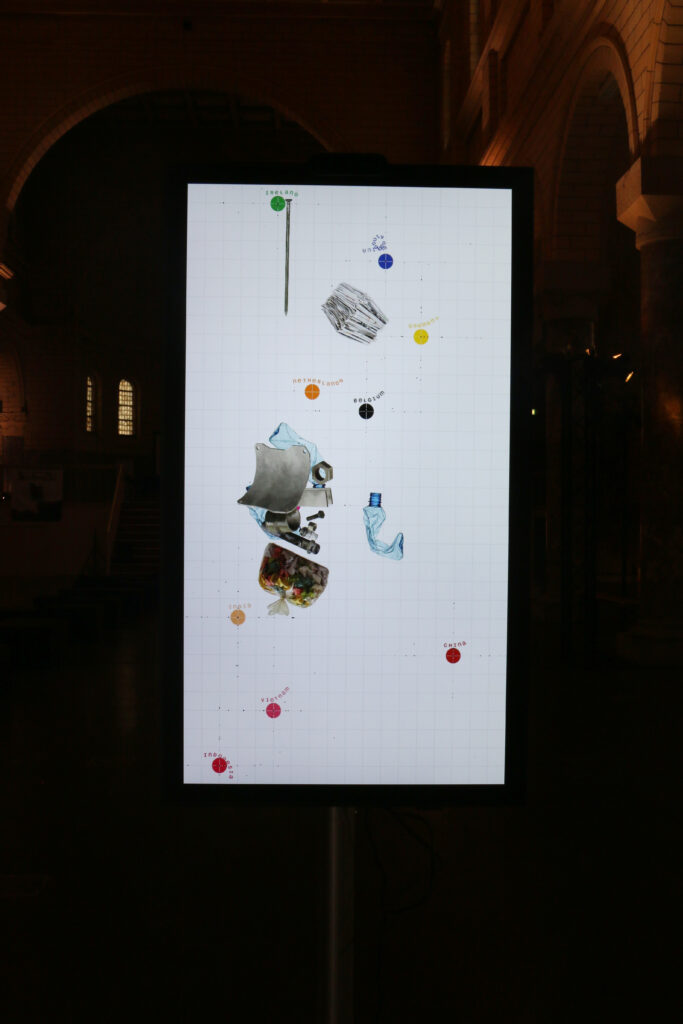
For the third screen, the total amount of Dutch exports of recyclable waste and the export destinations for recyclable waste between 2010 and 2018 is used as data source, coming from Statistics Netherlands (CBS). Nine countries world-wide received over 80% of Dutch household waste. And I focus on the five main types of Dutch waste that are exported: metal, textile, plastic, combustion waste, and paper. In 2010, nearly half of all plastic waste generated by businesses and households had China as a foreign destination. However, in 2018, China’s share in Dutch exports of recyclable plastic waste was only 2.7 percent. In 2018, over three-quarters of plastic waste were destined for a country within Europe. Germany was one of the most important destinations and recorded the strongest increase in waste imports compared to 2010.
The installation shows an abstract map representing all countries involved in the waste export business. Images of waste fly from source to destination country on screen, leaving a black trace in the vicinity of the destination country. In the installation, the presence of visitors is captured and it influences the way waste is animated on the screen.
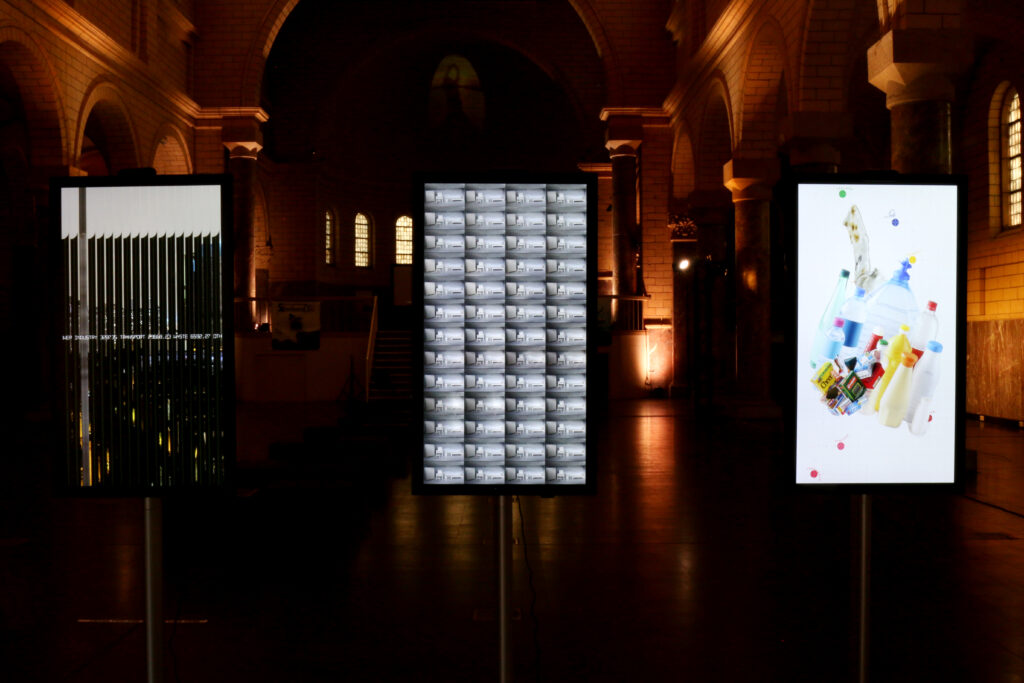


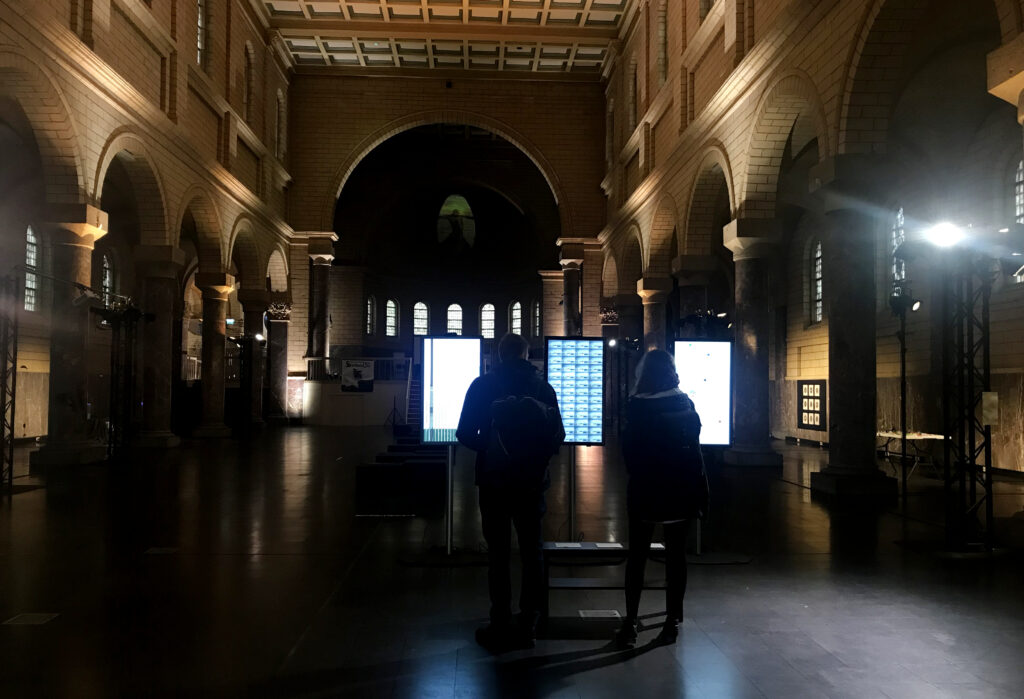
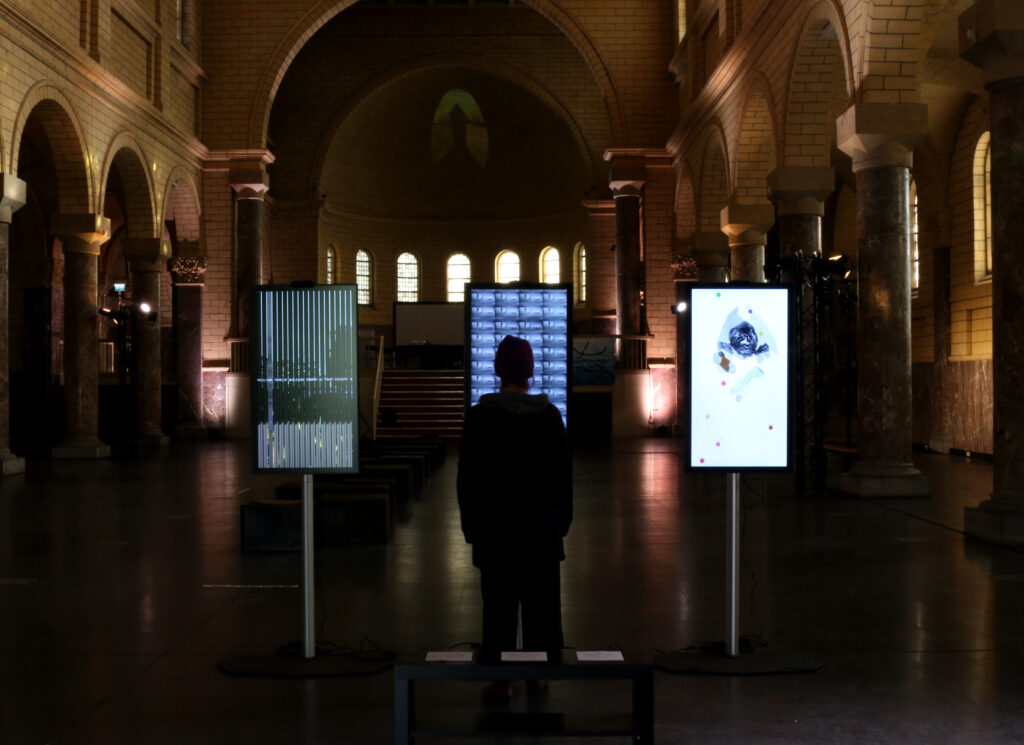

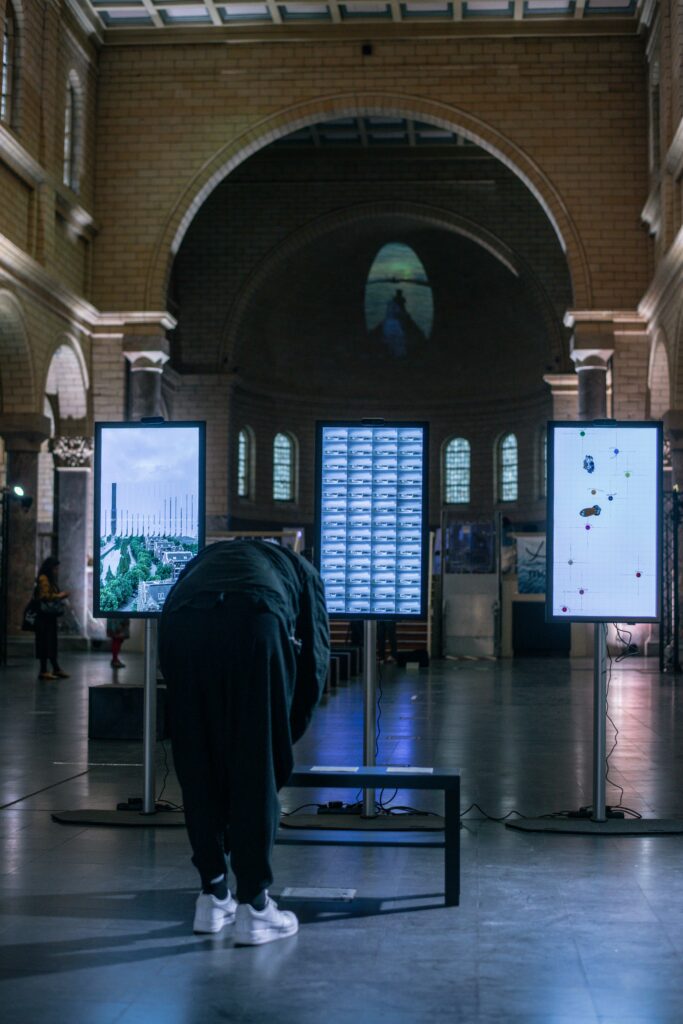
Exhibition at Steentjeskerk Church in Eindhoven between 10 and 24 October, 2021


Exhibition at ATELIER NO.66 PACT Zollverein on 22 and 23 April, 2022.
© Photo: Dirk Rose / PACT Zollverein